Exploring Community Fishery Engagement
Jean Lee
Building on prior work by the the AKFIN and PacFIN programs to build products that support the analysis of fishing communities, AKFIN has collaborated with the Alaska Fisheries Science Center (AFSC) and the PSMFC GIS team to develop a dashboard tool where users can explore communities’ engagement in commercial fisheries of the North Pacific.
fishing community:
a community which is substantially dependent on or substantially engaged in the harvest or processing of fishery resources to meet social and economic needs, and includes fishing vessel owners, operators, and crew and United States fish processors that are based in such community
-Magnuson Stevens Fishery Conservation and Management Act
In recognition of the importance of fishery communities, National Standard 8 of the Magnuson Stevens Act mandates that federal fishery policies and regulations must account for how communities are engaged in fisheries, in order to provide for those communities’ sustained participation and minimize adverse economic impacts. Building on prior work by the AKFIN and PacFIN programs to build products that support the analysis of fishing communities, AKFIN has collaborated with the Alaska Fisheries Science Center (AFSC) and the PSMFC GIS team to develop a dashboard tool where users can explore communities’ engagement in commercial fisheries of the North Pacific.
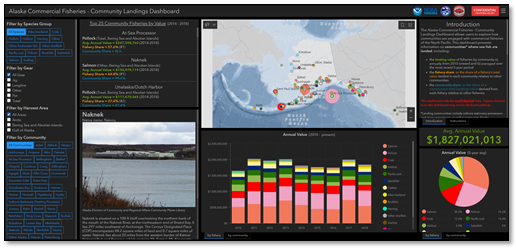
The Alaska Commercial Fisheries – Community Landings Dashboard focuses on one dimension of community fisheries participation—the community of landing. The dashboard allows users to visualize the locations where raw fish are landed, including shoreside communities in Alaska and the Pacific Northwest. Also accounted for are landings to at-sea processors (i.e., catcher processors and motherships), which represent a significant share of landings in groundfish fisheries.
The Community Landings Dashboard leverages functionality within the ArcGIS Dashboard web platform to support the interactive exploration and visualization of data. Charts within the dashboard allow users to see the relative significance (in terms of landing ex-vessel revenue) of a fishery to a particular community relative to other fisheries, as well as the distribution of a fishery’s landings across communities. Time series of landings by fishery and by community portray how these metrics of fishery engagement have changed over time. Filters can be used to specify data for a set of fisheries and/or a set of communities.
AKFIN users interested in using this dashboard should contact jean.lee@noaa.gov to inquire about access.